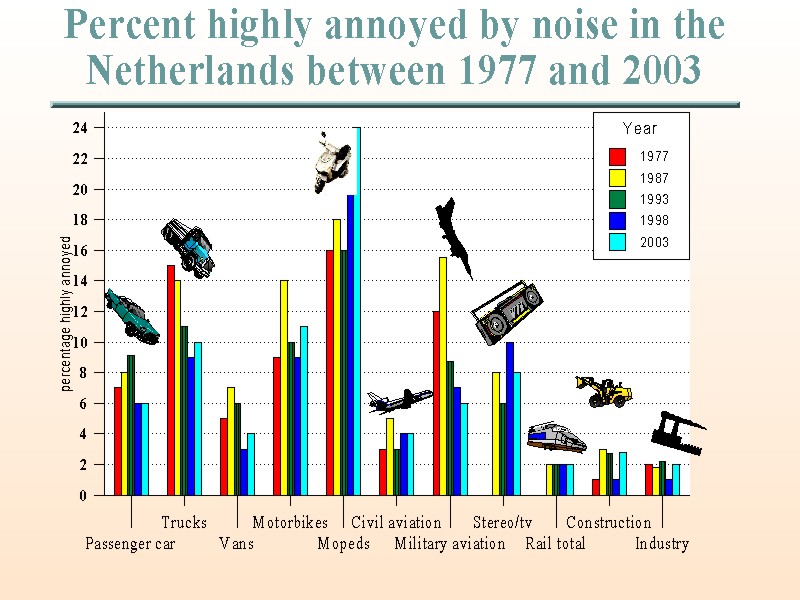
Serious annoyance in the Population in the Netherlands
(% of people over 16 yrs)

Here you will find these statistics:
These stats are based on surveys held in 1987, 1993,1998 and 2003 amongst 4000 inhabitants. The surveys were carried out by TNO and in 2003 by RIVM. The recent 2003 data are based on the RIVM/TNO survey published in 2004. The report (815120001 / 2004) is available from the RIVM-site, but only in Dutch language. An English summary is available here.
Serious annoyance in the Population in the Netherlands
(% of people over 16 yrs)
| Percentage highly annoyed in the Dutch population. Total higly annoyed is around 40%. | ||||
| source | 1987 | 1993 | 1998 | 2003 |
|---|---|---|---|---|
| Road traffic, urban > 50 km/hr *) | 12 % | 8% | 9% | 11% |
| Road traffic, highways | 4% | 2% | 2% | 2 |
| Mopeds | 18% | 15% | 20% | 24 |
| Motorcycles | 14% | 10% | 9% | 11 |
| Motorcars | 8% | 9% | 6% | 6 |
| trucks | 14% | 11% | 9% | 10 |
| vans | 7% | 6% | 3% | 4 |
| buses | 5% | 5% | 3% | 3 |
| military aircraft | 16% | 9% | 7% | 6 |
| helicopters | 6% | 3% | 3% | 3 |
| stereo/tv/radio neighbours | 8 % | 6% | 10% | 8 |
| civil aircraft | 5 % | 3% | 4% | 4 |
| leisure activities | 5 | 4 | 4 | 5 |
| rail traffic noise | 1,3% | 1,4% | 1% | 1 |
| construction equipment | 3% | 3% | 2% | 3 |
| industry | 1,8% | 2,2% | 1% | 2 |
| Lden | Lnight | |||||||||
| Source | <49 | 50-54 | 55-59 | 60-64 | >64 | <39 | 40-44 | 45-49 | 50-54 | >54 |
| Motorways | 76.1 | 14.2 | 6.7 | 2.1 | 1 | 70.2 | 16.2 | 9.1 | 3.1 | 1.4 |
| Regional roads | 94.3 | 3.1 | 1.5 | 0.8 | 0.3 | 93.8 | 3.4 | 1.6 | 0.8 | 0.3 |
| City roads | 64.8 | 17.3 | 12.9 | 4.6 | 0.5 | 57.9 | 17.7 | 15.2 | 8 | 1.3 |
| All roads | 35 | 34.6 | 21.1 | 7.5 | 1.8 | 21.9 | 37.3 | 25.9 | 11.9 | 3 |
| Railways | 82.3 | 10 | 4.5 | 2 | 1.3 | 76.6 | 12.4 | 6.3 | 2.7 | 1.9 |
| Amsterdam Airport | 96.7 | 2.8 | 0.4 | 0.1 | 0 | 98.1 | 1.4 | 0.5 | 0 | 0 |
| Cumulative | 26.9 | 29.3 | 28 | 12 | 3.8 | 18.6 | 24.7 | 31.3 | 18.6 | 6.8 |
