5 Description of alternatives
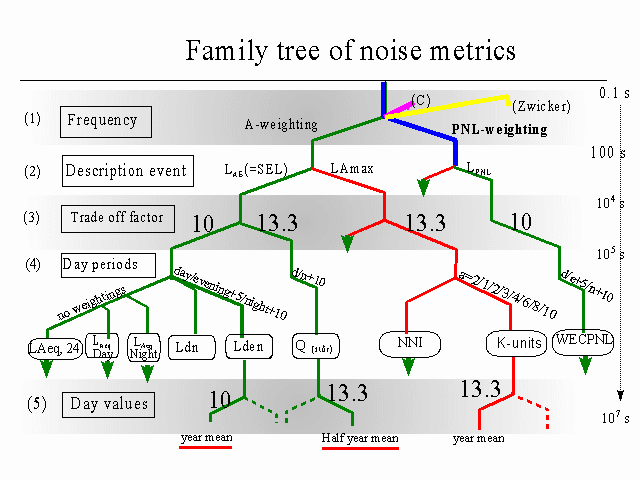
The Working Group considered the model proposed by Miedema [25] a fruitfull basis for their discussions. In this model the design of a noise metric is broken down into discrete, hierarchical steps. The basic concept is that a sound environment can be thought of as being composed of a large number of short sound samples each made up of contributions from different frequency bands. Of course, each "soundscape" can be recorded in full, but this would produce a huge amount of detail which would not be suitable to base decisions on. The purpose of an indicator is to reduce this large volume of information to a quantity which is still meaningful but easier to handle. It is inevitable that information about individual contributions will be lost, but this has to be accepted. This can be done in much the same way that indicators are made for stock markets and the state of the global climate (based on the average annual temperature).
After reducing the frequency information in the initial step, each subsequent step reduces the time scale by roughly a factor 100. This ultimately results in 1/10 sec noise "time-slices". The steps are numbered 1 to 5 in the tree-like figure 6.
The purpose of this breaking down process is to be able to decide which branch to follow based on specific knowledge about the way people react to certain sounds.
1. The first step is to reduce the frequency content to 1 number. The A-weighted procedure is most often used. Other possibilities are B, C, D, PNL or Zwicker/Stevens. See Annex 4 for a definition of the procedures.
2. In the second step a value per event is obtained. At present only two procedures are used: either the energetic summation with no weightings, which gives the familiar LAx or the maximum level per event, giving the equally familiar LAmax.
3. The sum of the number of events per day period (day, evening, night). Again there are two commonly known procedures:
- energetic summation, which gives the LAeq per event
- summation with a weighting factor of 13.3.
As this weighting factor depends on how many less noisy events can be traded for one event at a certain higher noise level, this is commonly known as the trade-off factor.
4. In its simplest form without adjustments, the day, evening and night periods are summed and averaged to give a 24 hour value. In the more elaborate forms either evening/night or night only corrections are included. Factors of 10 for the night, or a combination of factors of 3.16 (5 dB) for a 4 hour evening and 10 for an 8 hour night are currently in use.
5. In this step the long term mean is calculated by means of energetic summation and averaging. Although this is rarely done, this step could further be broken down into weekday/weekend periods, and summer/winter day periods with or without their accompanying weightings.
By breaking down the process, the decision process can be guided by considering at each step what evidence there is for one direction or factor or another. The decisions concerning the best directions or the best factors, will depend on their relationship to the effect to be predicted. It is therefore quite conceivable that different indicators will be needed for different requirements; an indicator for complaints could look very different from an indicator for sleep disturbance.
It is interesting to see how in this way "families" of noise indicators begin to emerge. There is an "LAmax" group, with the NNI and the Dutch K-unit. The German Stör-index belongs to the LAeq-group, but shares the trade-off factor of the K-unit. Which is the best, we may ask? Instead of looking at the overall success in predicting adverse effects (a very difficult task with any indicator), it should first be established whether a trade-off factor of 10 is better than one of 13.3. At least this is a simpler question. The same goes for the choice of Lmax as a basic indicator (layer 2) or LAeq per event.
The figure is very limited. There are literally hundreds of indicators, and if specific local differences were to be included the figure could become very complex.
This exercise can only be done for a limited number of all possible noise effects at present. These are speech interference, annoyance and sleep disturbance. The different aspects are discussed in the following sections.
With the invention of the electrical sound meter it was discovered that the ear has a different sensitivity than the microphone. The greatest sensitivity of the human ear lies around 4000 Hz, and the ear is less sensitive to lower and higher tones. To correct for this, so-called frequency weightings were proposed and readily accepted as early as 1926. In years which followed the A-weighting gained overall acceptance. Without going into much detail (there is a vast amount of literature on this topic, see Annex 3 and [Kryter, 33]), it can be stated that this simple approach has been under discussion ever since. Although different systems of frequency weighting have been developed (by Stevens and Zwicker, among others), only the Perceived Noise Level (PNL) has had any practical application in some aircraft noise indicators. However, it should be noted that often a simple rule of thumb is used to derive the PNL level from the A-weighted level. In most cases these more complicated approaches have been abandoned by the simpler and more widely accepted practice of A-weighting. Although it can be demonstrated that other frequency weightings have some advantages over A-weightings in predicting loudness, there is evidence that applying these weightings does not much improve the correlation between annoyance and indicators based on this.
A special case which deserves attention, however, is low-frequency noise. The A-weighted level tends to underestimate or neglect noise below 100 Hz. (See annex 5 for a precise definition.)
As low-frequency noise has been linked to effects of some severity, and the difference between audible and annoying is very small, special attention must be given to sources where low-frequency noise may be expected or in cases where symptoms (e.g. dizziness, nausea) may give a clue.
A criteria by which to judge whether low-frequency sound could give rise to problems is to look at the difference between the C (or unweighted) sound level and the A-weighted sound level. If the difference exceeds 20 dB, then further analysis for low-frequency is required. Further research may produce more precise information. Another method of measuring and assessing low-frequency noise emissions in the neighbourhood is given by the German standard DIN 45 860.
There are two commonly used methods to evaluate the level of an event. The first is to derive an LAeq type of indicator, where the total energy content of an event is taken. The resulting value (LAE according to ISO; also indicated as SEL or LAx) can be used to determine a long term LAeq. It can also be used as an indicator for short term sleep interference.
The second method takes only the maximum value of an event, thereby ignoring the fact that, given the same LAmax level, an event could be long or short, and presumably a longer event is more likely to cause effects than a very short event. Traditionally, this indicator was easier to measure than LAeq per passage, and plays a role in older types of composite indicators (Kosten-unit, NNI) and in some regulations. Based on the above considerations, it appears that the first approach gives a more accurate description of the situation, therefore this is the preferred method for use in future indicators.
Basically there are two trade-off factors currently in use: 10, which is equivalent to the physical energy content and 13.3, used in Dutch and German aircraft noise indicators. The effect of a higher trade-off factor is to put more emphasis on the number of events than on their levels. This leads to bigger changes in the indicator when the number of events (airplane passages) change than with indicators based on the equal energy principle. The following table illustrates this principle for the two trade-off factors now in use; it shows how many events of a certain level are allowed to reach an average level of 50 dB when these events occur in one night of 8 hours.
| Level per event | Number of events that give equal level of indicator | |
| trade-off factor 10 (LAeq's) | trade-off factor 13.3 (Q, Kosten, NNI) | |
| 85 | 10 | 10 |
| 75 | 100 | 56 |
So with a factor of 10 a 10 dB lower level per event may be exchanged for 10 times the number of events (second column), and the same 10 events may be exchanged by approximately 5 times as many 75 dB(A) events in the case of a factor of 13.
Although a considerable amount of research has been done to establish the best fitting trade-off factor [see the discussion in ref. 1 and in ref. 14], this has not produced any clear answer. In field studies, indicators with either higher or lower factors than 10 do not significantly improve the correlation with the effects. It is in view of this that the Working Group recommends that the equal energy principle be applied.
There are good reasons to suppose that people's sensitivity to outdoor environmental noise varies depending on what they are doing at the time. Many people are away from home at work, at school, or at play for considerable parts of the day and would therefore not be exposed to the prevailing sources of environmental noise in the area at those times. There is some evidence that residents become more sensitive to outdoor environmental noise when they are at home during the evenings, and that they are most sensitive to environmental noise when they are at home at night. The precise definitions of day, evening, and night vary in different Member States and any attempt at harmonisation here is unlikely to be successful owing to the different weather conditions and cultural norms prevailing at different times of the year in different countries.
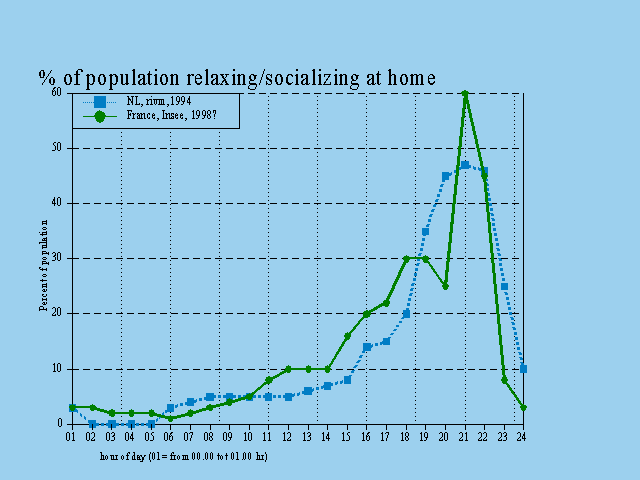
The figures which follow provide examples of the evening period, expressed as the percentage of people at home and relaxing, and night-time, expressed as a percentage of people asleep.
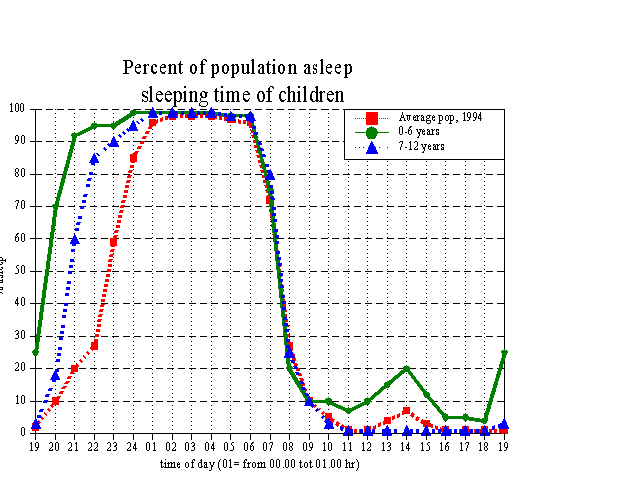 From figure 7 it can be seen that the beginning of the evening should start
somewhere between 16.00 and 19.00 hours, and end between 22.00 and 24.00
hours. Another argument for defining the evening is the sleeping time of young
children. From figure 8 it can be seen that the evening is a critical period for
children, as it represents the onset of sleeping time. Although children are less
sensitive to noise once asleep, most parents will testify that quiet is much
appreciated when it comes to putting our little ones to bed!
From figure 7 it can be seen that the beginning of the evening should start
somewhere between 16.00 and 19.00 hours, and end between 22.00 and 24.00
hours. Another argument for defining the evening is the sleeping time of young
children. From figure 8 it can be seen that the evening is a critical period for
children, as it represents the onset of sleeping time. Although children are less
sensitive to noise once asleep, most parents will testify that quiet is much
appreciated when it comes to putting our little ones to bed!
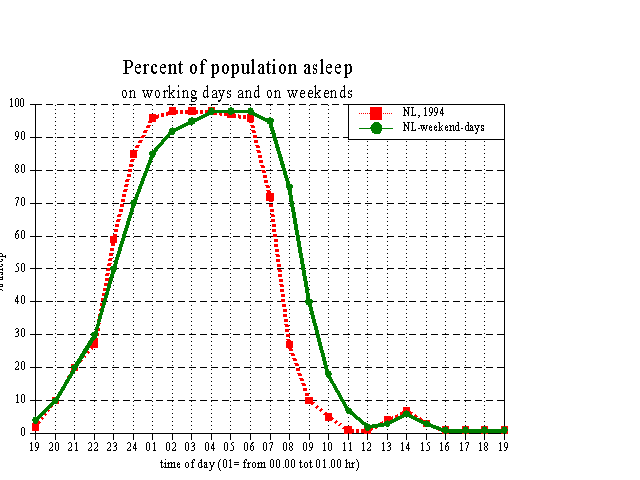
The beginning and end of the night period can be studied in a similar manner. From the available data ([Fields, 9] and [Freyer, 10], it is clear that the night period starts and ends one hour later at the weekend. This kind of data can be of great help when comes to making a qualified judgment about evening and night periods.
Something could be said about the length of the night-time. Most people are aware that the mean sleeping time is around 7 � hours. Hence the length of the night period cannot be shorter. What is less obvious is that we don't all go to bed at the same time, so the night period needs to be somewhat longer in order to protect the early-to-bed early-to-rise types as well as the late-to-bed late-to-rise types. This leads to a minimum night
Based on these considerations, the Working Group recommends a 12 hour day period, a 4 hour evening period and an 8 hour night period. The individual Member States will have to define the start and end of the time periods according to local custom and practise. This may cause some slight discrepancies between adjacent countries if they decide on different definitions. However, this is comparable to the present time-zone differences which Member States already deal with.
A second recommendation in this area is to keep the weekend, especially Sunday, as a separate identifiable period.
After having defined and assessed the day, evening and night periods the next integration step is to combine these values into one 24 hour level. The simplest way to do this is to combine them without weighting factors into what then becomes a 24 hour average. Obviously, in this way the advantage of calculating them separately for sensitive periods is lost. So if they are to be combined in order to arrive at a single number indicator, a different approach is needed.
As can be seen from Figure 6, most present indicators use at least a night-time correction and some also have an evening correction. If corrections are used, they are 5 dB for the evening and 10 dB for the night (or multiplication factors to this effect, like multiplying the number of events in the evening by 3.16).
It is surprising that there are relatively few studies demonstrating the benefits of these correction factors when it comes to predicting annoyance. It is almost certain that the origin of these factors is derived from the knowledge that night levels are (or were) usually about 10 dB lower than daytime levels, and evening levels were in between. However, this may change in the future and there are well known examples where the difference is already much smaller.
Recent studies [referred to in Gezondheidsraad, 14] showed only slight benefits from various correction factors. The main reason could very well be that there is usually a close correlation between the periods and the differences are small. However, the
The Working Group therefore recommends that if day, evening and night levels are combined into one, the 5 and 10 dB correction factors should be used.
Most environmental noise varies from day-to-day, from hour-to-hour, and from minute-to-minute. The variations at the receiving point are caused by:
a) variations in source strength;
b) variations in transmission, which are often caused by variations in meteorological conditions.
For most purposes (strategic planning, mapping, zoning, calculation of noise measures), an average over a longer period at the assessment point is needed. It is anticipated that this number will show better correspondence with long term effects. However, for some specific purposes like complaints or other momentary effects an indicator with a shorter time period may be more suitable.
For relatively constant noise or noises with fixed patterns, such as that caused by road traffic, rail traffic, airports or large industrial noise sources, it makes no practical difference whether the basic LEU is determined over a shorter or longer averaging time. However, for irregular or intermittent noise, such as that caused by low flying military aircraft, there will often be a frequency of events below which any long time average of the amount of physical noise present becomes less descriptive of the actual situation. These situations fall outside the scope of this type of indicator, and should be left to individual judgment whenever they occur. Based on practical experience, a rough indication would be to treat different sources which operate less than 20% of the time, or where less than 1 event per hour occurs - averaged over de the relevant period. This does not mean that these sources do not cause problems, but that it varies according to circumstances.
Another aspect of the long term average is the relationship with instantaneous sound levels. As with most averages, during part of the time the noise level will be over the average, and the amount will be higher if the time base is shorter. So Lmax levels (averaging time 125 ms) will be much higher than a year mean LAeq, but also an hour LAeq will often be higher (and equally as often, lower, of course).
This is an important aspect which has to be taken into account when setting standards or limits. A short term indicator is much easier to enforce, but says very little about the actual situation, while a long term mean is more complicated to enforce but is likely to have better correlation with long term effects.
What has been said about the variations in source strength, can also be said about the variations in propagation conditions. If the aim is to predict a long term mean, this should also cover the long term variations due to changing weather and ground conditions.
This long term average sound level is almost an abstract entity with an asymptotical character: it can be approached as close as you like (or until resources are exhausted), but it cannot be assessed with 100% certainty. In most cases it will not be possible to have valid measurements under all potential weather conditions. This means that to derive the long term average, a certain amount of calculation has to be done. One procedure is to use downwind measurements (which give a stable, reproducible sound level), and correct them for the average weather conditions. Another method would be to collect as many measurements as possible for all weather conditions and to calculate from long term meteorological statistics what the sound level would have been. This Working Group does not wish to make any recommendations about the best way, since it is the task of Working Group III, measurements and calculation, to define the assessment methods for long term average noise levels. This WG would like to point out, however, that for most assessment procedures, the short range is more important where meteorological parameters have less influence.
Comparing noise legislation in different countries often results in different figures which in reality do not necessarily reflect different situations. This anomaly may partly be caused by a difference in assessment points. This section will first review current practice and then discuss a proposal for harmonisation.
International standards and outdoor assessment points
The current ISO 1996 gives as a general measurement position:
- in the free field condition, a distance of 3.5 m from reflecting structures or 0.5 m from an open window;
- near buildings the distance becomes 1-2 m from the façade;
- measurement height is generally 1.2-1.5 m, for land use purposes it can be higher.
Other national standards are very similar. The ANSI Standard 12.9 (part 4) in the US states that "all sounds will be measured or predicted as if they had been measured by a microphone outdoors over an acoustically absorptive ground (grass) at a height of 1.2 m with no nearby reflecting surfaces (except ground)".
Free field versus façade
When assessments are made for a situation in front of a building, there are various ways that this can be done:
- assessment in a free field, more than 3-4 m from the façade: in this case the measured level will be the incident level;
- assessment within 1-2 m from the façade: due to reflections the level will be approximately (influenced by the form of the facade) 3 dB higher than the real incident level (3 dB-factor);
- assessment before or at an open widow: the level will be the incident level;
- measuring microphone mounted on the window or in the façade: the measured level will be 6 dB higher than the incident level.
Several of the above methods are in use for noise regulations in the Member States.
Height
The height of the assessment position has a major influence on the noise level measured.
Assessments which are made at a height of 1.2-1.5 m lead to wide variations in level for low and medium frequencies. Greater assessment heights reduce the influence of ground effects and low barriers, which improves reproducibility. It is therefore preferable to define noise levels at a greater height than the current 1.2-1.5 metres. A practical solution, where there are no other specific demands, is 4 metres above ground level. If circumstances require lower assessment points, special attention has to be paid to interference effects.
Street side versus rear
For busy street situations the difference in LAeq between the front and the rear of a building varies depending on the layout of the building and reflections but may reach 15-20 dB. This leads to great difficulties when, for example, noise limits based on traffic density on the street side are used to evaluate complaints concerning rooms at the rear of the building. Research shows that annoyance also depends on the difference between front and back. Current practice is to locate the assessment position on the facade with the greatest exposure.
Outdoor versus indoor
So far, only outdoor emission points have been taken into consideration. The document prepared for the WHO [1] states that it may not be possible to link a specific health effect due to noise with a specific noise source but rather that it is associated with exposure in a specific environment. Therefore interference with communication, annoyance and sleep disturbance are the critical effects in residential situations (these are also the effects referred to in the Working Group's Terms of Reference). These relate for the most part to indoor situations. Sleep disturbance effects refer entirely to indoors (bedrooms). Research shows, however, that these effects are related to inside levels as well as outside levels and - to some extent - the amount of insulation. This is probably due to the fact that, even in northern countries, a large proportion of the population likes to sleep with the windows open (up to 70% of the population), and exposure occurs outside (in gardens, on balconies) which are also sensitive settings.
In terms of international standardisation, indoor measuring conditions are set up in such a way as to avoid amplification in the lower frequencies by keeping the measuring position far enough from windows, walls and floor (1-1.5 m). However, when sleeping, a person's head is usually positioned on a pillow which is less than 50 cm from a wall. This can lead to important differences between measured levels to control prescribed limits and the actual annoyance experienced by the residents.
In view of this the Working Group has not made any recommendations regarding indoor assessment positions. This should be dealt with by the Member States in accordance with their own regulations.
Recommendations regarding harmonisation of assessment position
a. strategic mapping, land use and other planning purposes
The reference point in residential situations is at a height of 4 m, representing the incident level outdoors, including all reflections except reflections from the dwelling itself.
Semi-free field conditions are needed to obtain the incident level which can then be used to make insulation calculations to determine the indoor level, if necessary. If assessments have to be made and free field conditions cannot be obtained in practice, levels should be converted to an incident level condition (for a flat surface this means subtracting 3 dB; but this may differ for oddly shaped surfaces).
b. assessment of abatement measures and control
It is only reasonable to assume that when calculating the insulation of a façade, the noise level outside that façade also has to be calculated, at whatever height it is at. It is equally reasonable to take a height of 1.5 metres when calculating the effect of screens and barriers in gardens.
In these situations the Working Group's recommendation is to assess the incident level at the point where it is most relevant.