 The beneficial effects of porous surfaces on tyre/road noise are twofold:
The grey blocks represent the major noise generating processes. Each of these
processes exhibit specific frequency and speed characteristics. For instance the
aerodynamical and profile resonance effects emit noise at higher frequencies and with a
higher speed index than the texture induced vibration component. The surface
properties, relevant for the excitation of the different processes are given at the left
column. However, much more study is needed to exactly define these surface related
parameters. The indications are therefore only tentative.
In this model, the acoustic impedance of the surface, primarily acts as an absorber of
noise.
An important side effect is the suppression of aerodynamic noise because if the low
flow
resistance in the surface. Some slight effects may be expected from the change in
boundary conditions in the contact patch.
The effect of the acoustic absorption is modeled by the total noise emission multiplied
by the acoustic transmission of the surface. The development of a noise reducing porous
surface must therefore be focused on the following issues:
1 . optimization of the surface characteristics with respect to the noise generating
mechanisms;
2. tuning the acoustic absorption characteristic to the resulting spectral distribution of
acoustic energy.
Since the noise components differ with respect to vehicle type, frequency content
and
speed index, an optimal result can not be obtained in all conditions but will be restricted
to a certain speed range and a given mix of vehicle types.
was performed under simulated trafficked conditions on our test field on the airfield of
Welschap. Although this study was limited to small vehicles and a small set of truck tires
it already demonstrated the great potentials of porous surfaces to reduce traffic
noise.
These results were corroborated by a full scale test on a motorway where the
most
interesting types from the Welschap study were investigated under normal trafficked
conditions consisting of cars, light and heavy trucks. The relevant parameters of the
tested surfaces are given in table I. Adjacent to the test sections a reference surface was
lain.
| surface type | Stone size grading | thickness(mm) | frequency of maximum absorbance in Hz | max. absorbance % |
|---|---|---|---|---|
| dense | 0-16 | - | - | - |
| porous | 6-16 | 55 | 840 | 89 |
| porous | 4-8 | 60 | 810 | 95 |
| porous double layer | 4-8 (top) | 25 (top) 40 (bottom | 600 | 92 |
| porous | 8-11 | 50 | 900 | 87 |
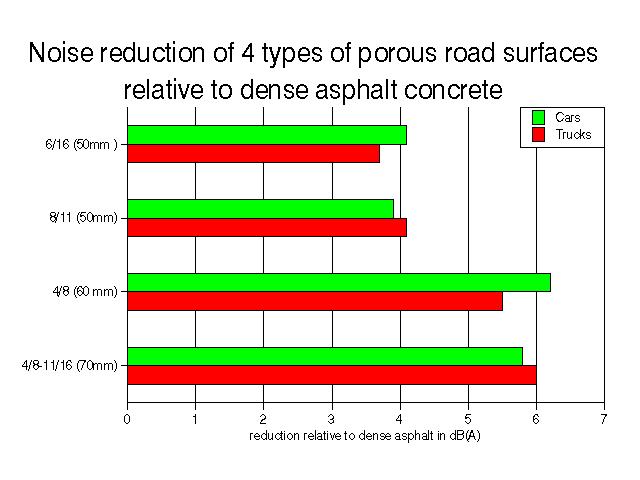
The noise emissions were measured according to the Statistical Pass-by method
(ISO 11819-1). The results were interpreted in terms of a reduction relative to the
adjacent dense reference surface (see Fig. 2).
This test clearly shows the great effect that porous surfaces have on the noise emission of
road traffic. This effect is not limited to passenger cars but, as can be seen from the
graph, also to heavy trucks. The maximal reduction of 6 dB re. DAC 0/16 is comparable
to a reduction of about 10 dB re. To transversely brushed concrete.
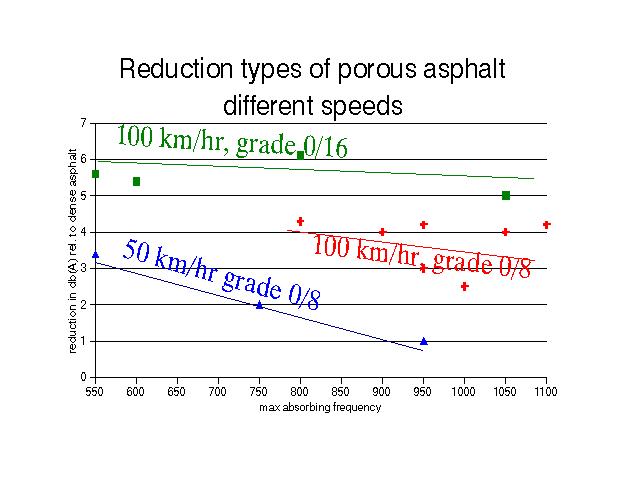
 As can be seen the stone grading, and thus surface texture,
is an important parameter. At low speed the reduction is furthermore influenced very
strongly by the frequency of the absorption
peak of the road surface.
As can be seen the stone grading, and thus surface texture,
is an important parameter. At low speed the reduction is furthermore influenced very
strongly by the frequency of the absorption
peak of the road surface.With kind permission of M+P Consulting Engineers